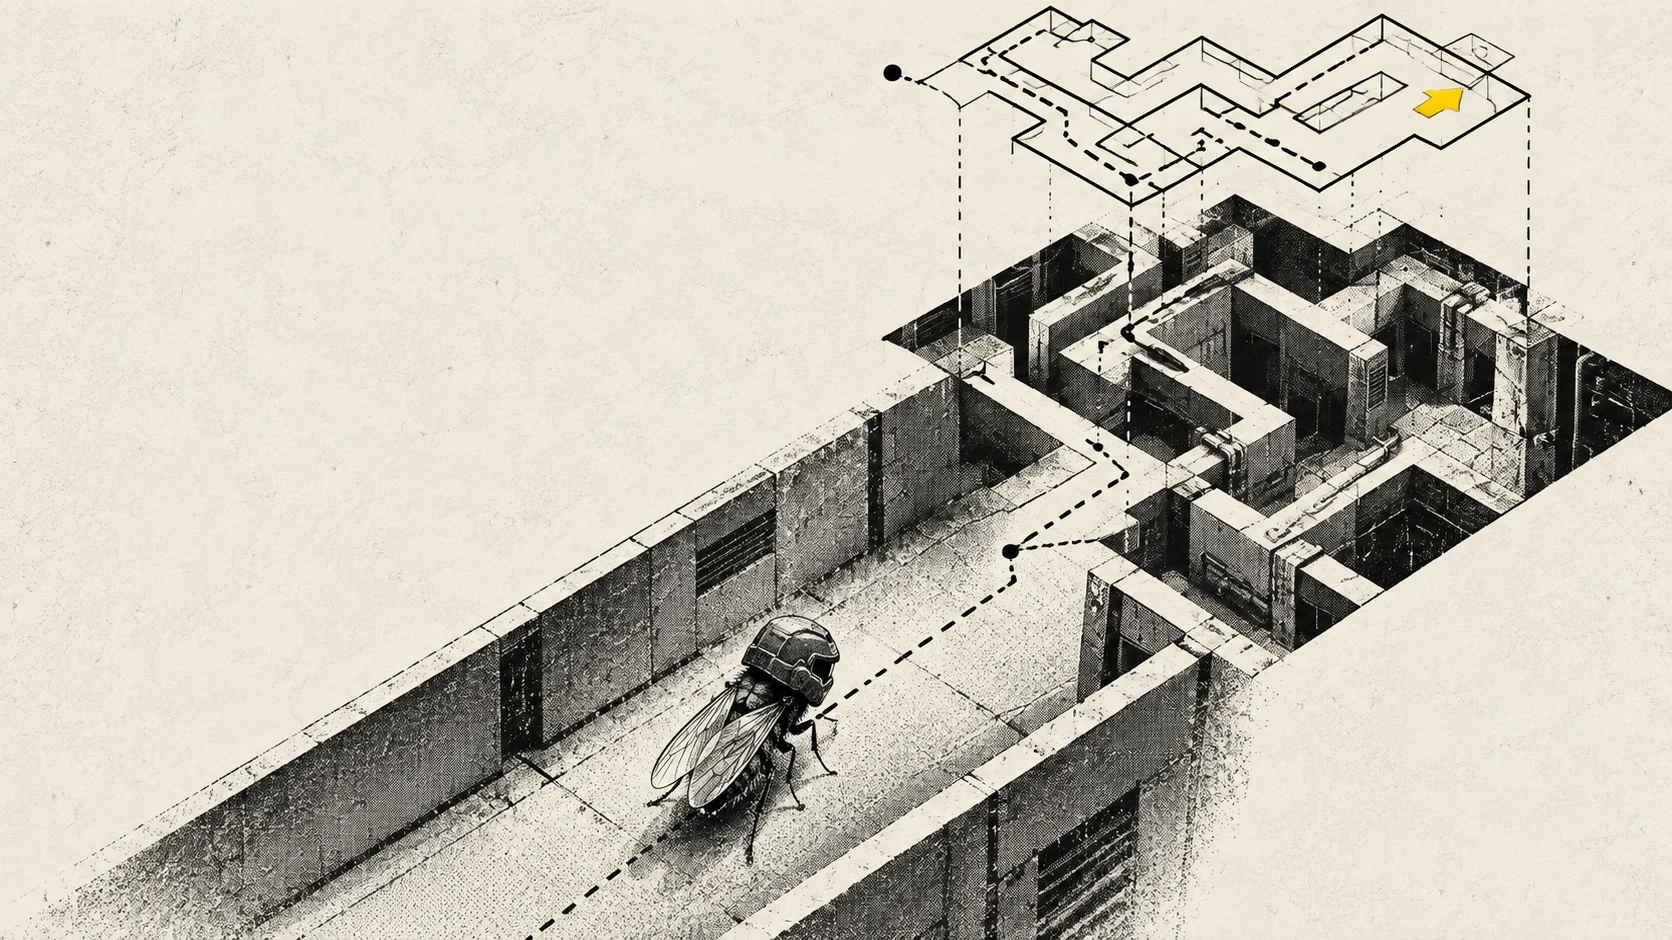
The fly reaches a junction, turns, and walks confidently down the next corridor. It is very easy to think it has figured something out. Especially with a “brain” blinking in the corner.
In the first article, we showed this walk and promised to explain how it works. An ordinary algorithm picks the route in our demo; it uses no actual connectome. But the digital fruit fly story begins with a real scientific achievement: researchers reconstructed the wiring of its brain.
What exactly ended up in the computer? And what does that map need before it can respond to a signal?
What researchers actually digitised
Think of a wiring diagram: which components connect, and where the wires go. Researchers can reconstruct a similar diagram for a brain. Nerve cells, or neurons, connect through contacts called synapses. A map of those connections is a connectome.
Researchers reconstruct cells and connections from electron microscope images of tissue. The FlyWire reconstruction of an adult female fruit fly brain, published in 2024, includes 139,255 neurons: a vast map of what connects to what in that particular brain. See the study of the connectome’s organisation and annotation.
It is tempting to try running that map immediately. All the connections are there; surely we just need to switch on the power. But a wiring diagram does not run on its own: the wires’ positions do not explain how the devices attached to them behave.
How a connection map becomes a model
The computer needs rules for how cells receive signals, fire, and affect their neighbours. It can then calculate activity step by step. In some models, it helps to picture a cell as a container: incoming signals bring it closer to a firing threshold or further away. Reach the threshold, and it sends a pulse onwards.
We now have two different things: a connection map and a model that uses it for calculations. The word “digitised” can easily blur that distinction.
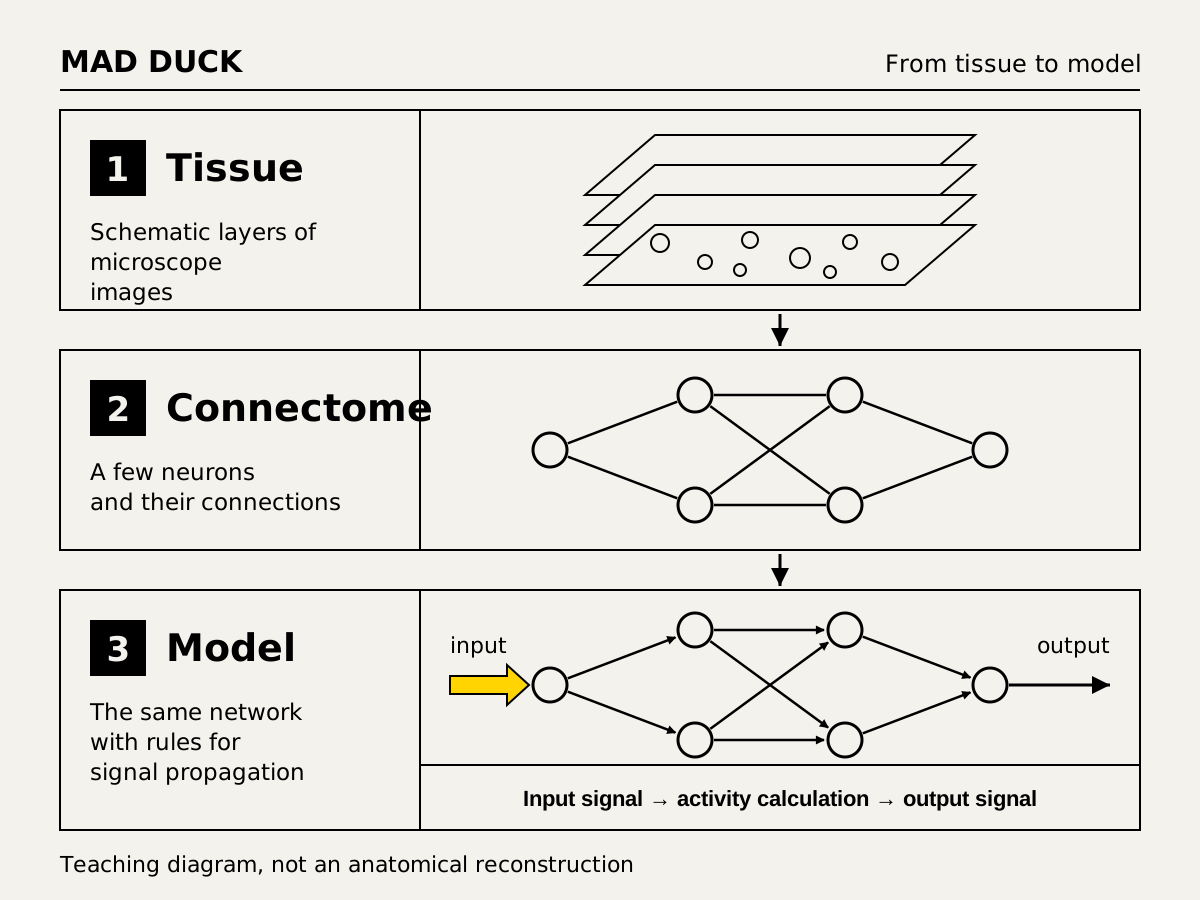
Having such a model does not establish that a particular fly’s memories or consciousness have moved into a computer. It does give us a testable task: apply a known input and see which cells respond.
How do you know the model works?
Take sugar. In a study of a computational fly brain model, researchers activated virtual sugar-sensitive cells and calculated responses in feeding-initiation circuits. They then tested predictions in living flies, including observations of proboscis extension.
That is the point: the model offers an explanation that can be tested outside the computer. A pretty pattern lighting up on screen tells us little about a nervous system. When a calculation helps predict the outcome of an intervention, we have a reason to trust it for that particular task.
Researchers can also control the activity of selected neurons in living flies. Optogenetics makes cells sensitive to light. In experiments with descending neurons, activation elicited various movements, with responses also depending on what the animal had been doing beforehand.
So the familiar “signal → action” sequence does not mean a fly has a set of forward and reverse buttons inside. The relationship between an intervention and behaviour needs investigation. Success in one experiment does not establish that a model reproduces the fly’s entire life, either.
How this idea ended up in DOOM
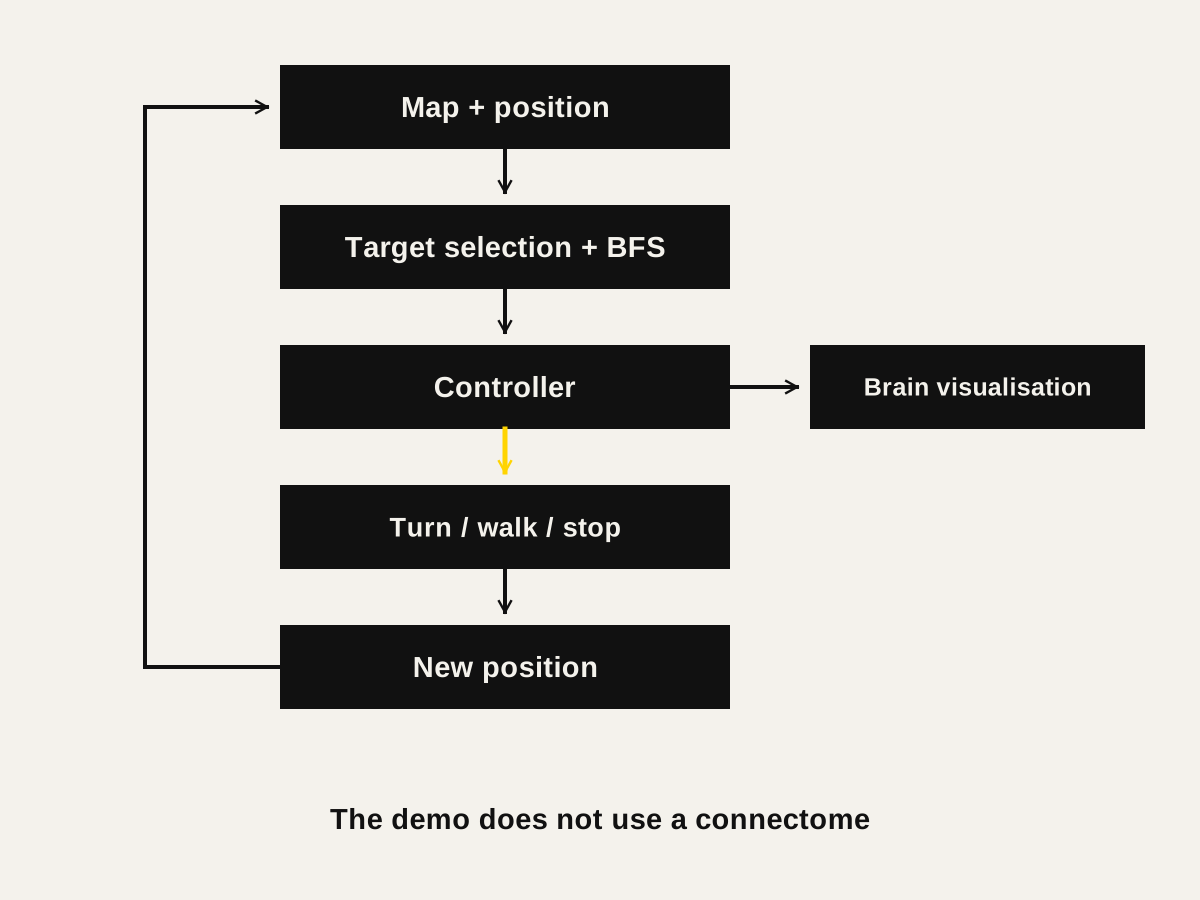
For our game scene, we kept the basic idea: a control signal produces movement. We neither imported nor pruned a scientific network; we wrote a separate controller. It receives a prepared map and coordinates. It does not need to inspect a corridor, recognise a door, or guess where the exit is.
What is blinking in the corner, then? The visualisation reads the controller’s signals: turning now, walking now, stopping now. It makes the action easier to follow. The glowing dots do not make decisions themselves.
Who guides the fly through the maze?
To the program, the map resembles a subway diagram: points and permitted connections between them. An algorithm selects another target and finds a route. The controller turns the fly towards the next point and enables movement. The legs are animated to match the walk.
Reach the target, pause briefly, then follow another route. Visit every target, and a new round begins. That is where the endless wandering comes from: we wrote a traversal loop and never gave it a victory screen.
Technical details — routes and signals
Finding a route
The points and connections form a graph. It can contain loops, so the map itself is not necessarily a tree. We find paths using breadth-first search, or BFS: check immediate neighbours first, then the next layer. Previously discovered points are not added to the queue again.
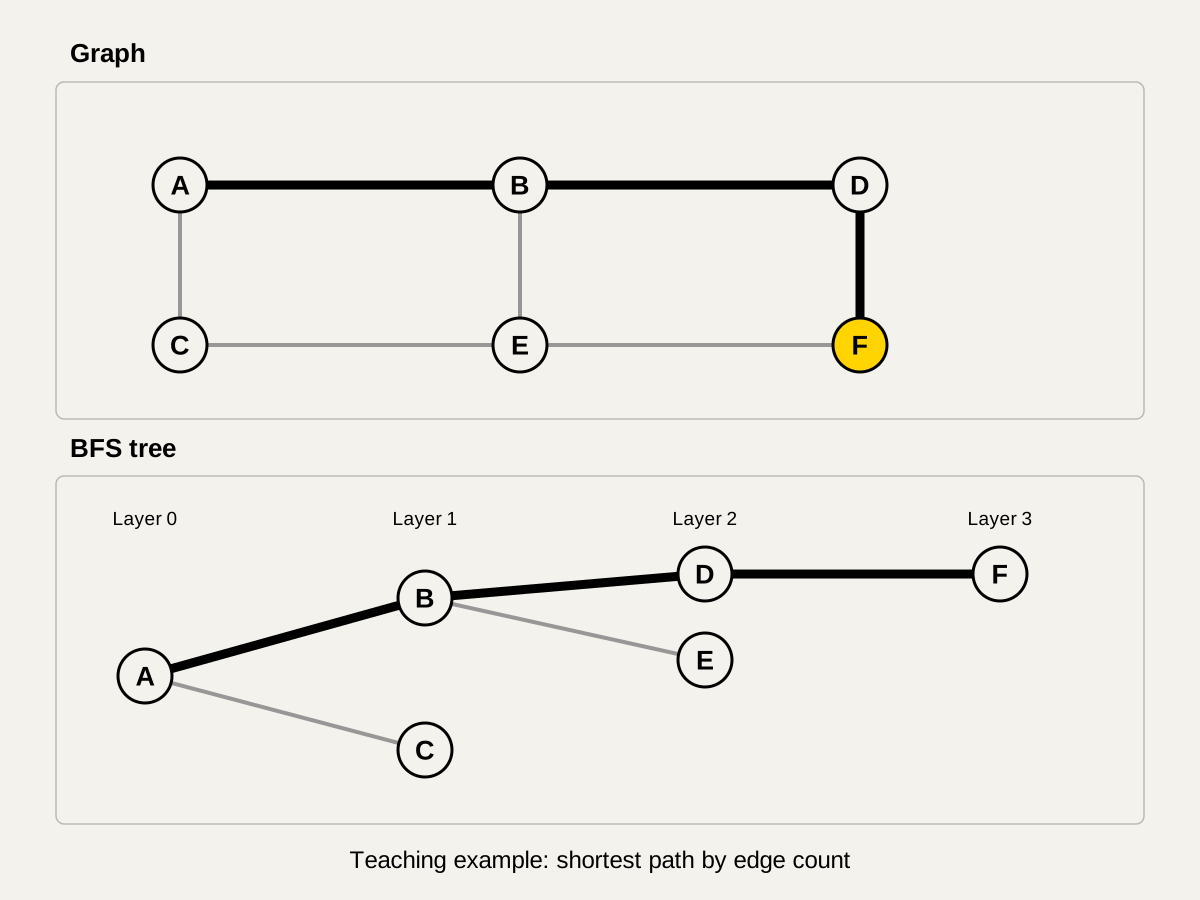
Starting at A, the search discovers B and C, then D and E, then F. One shortest route is A → B → D → F. Here, shortest means the fewest transitions; turning and lift time are not scored separately.
What the commands look like
The fly turns on the spot until its heading is close enough to the required direction. Movement then switches on. The chart below illustrates this sequence using synthetic data.
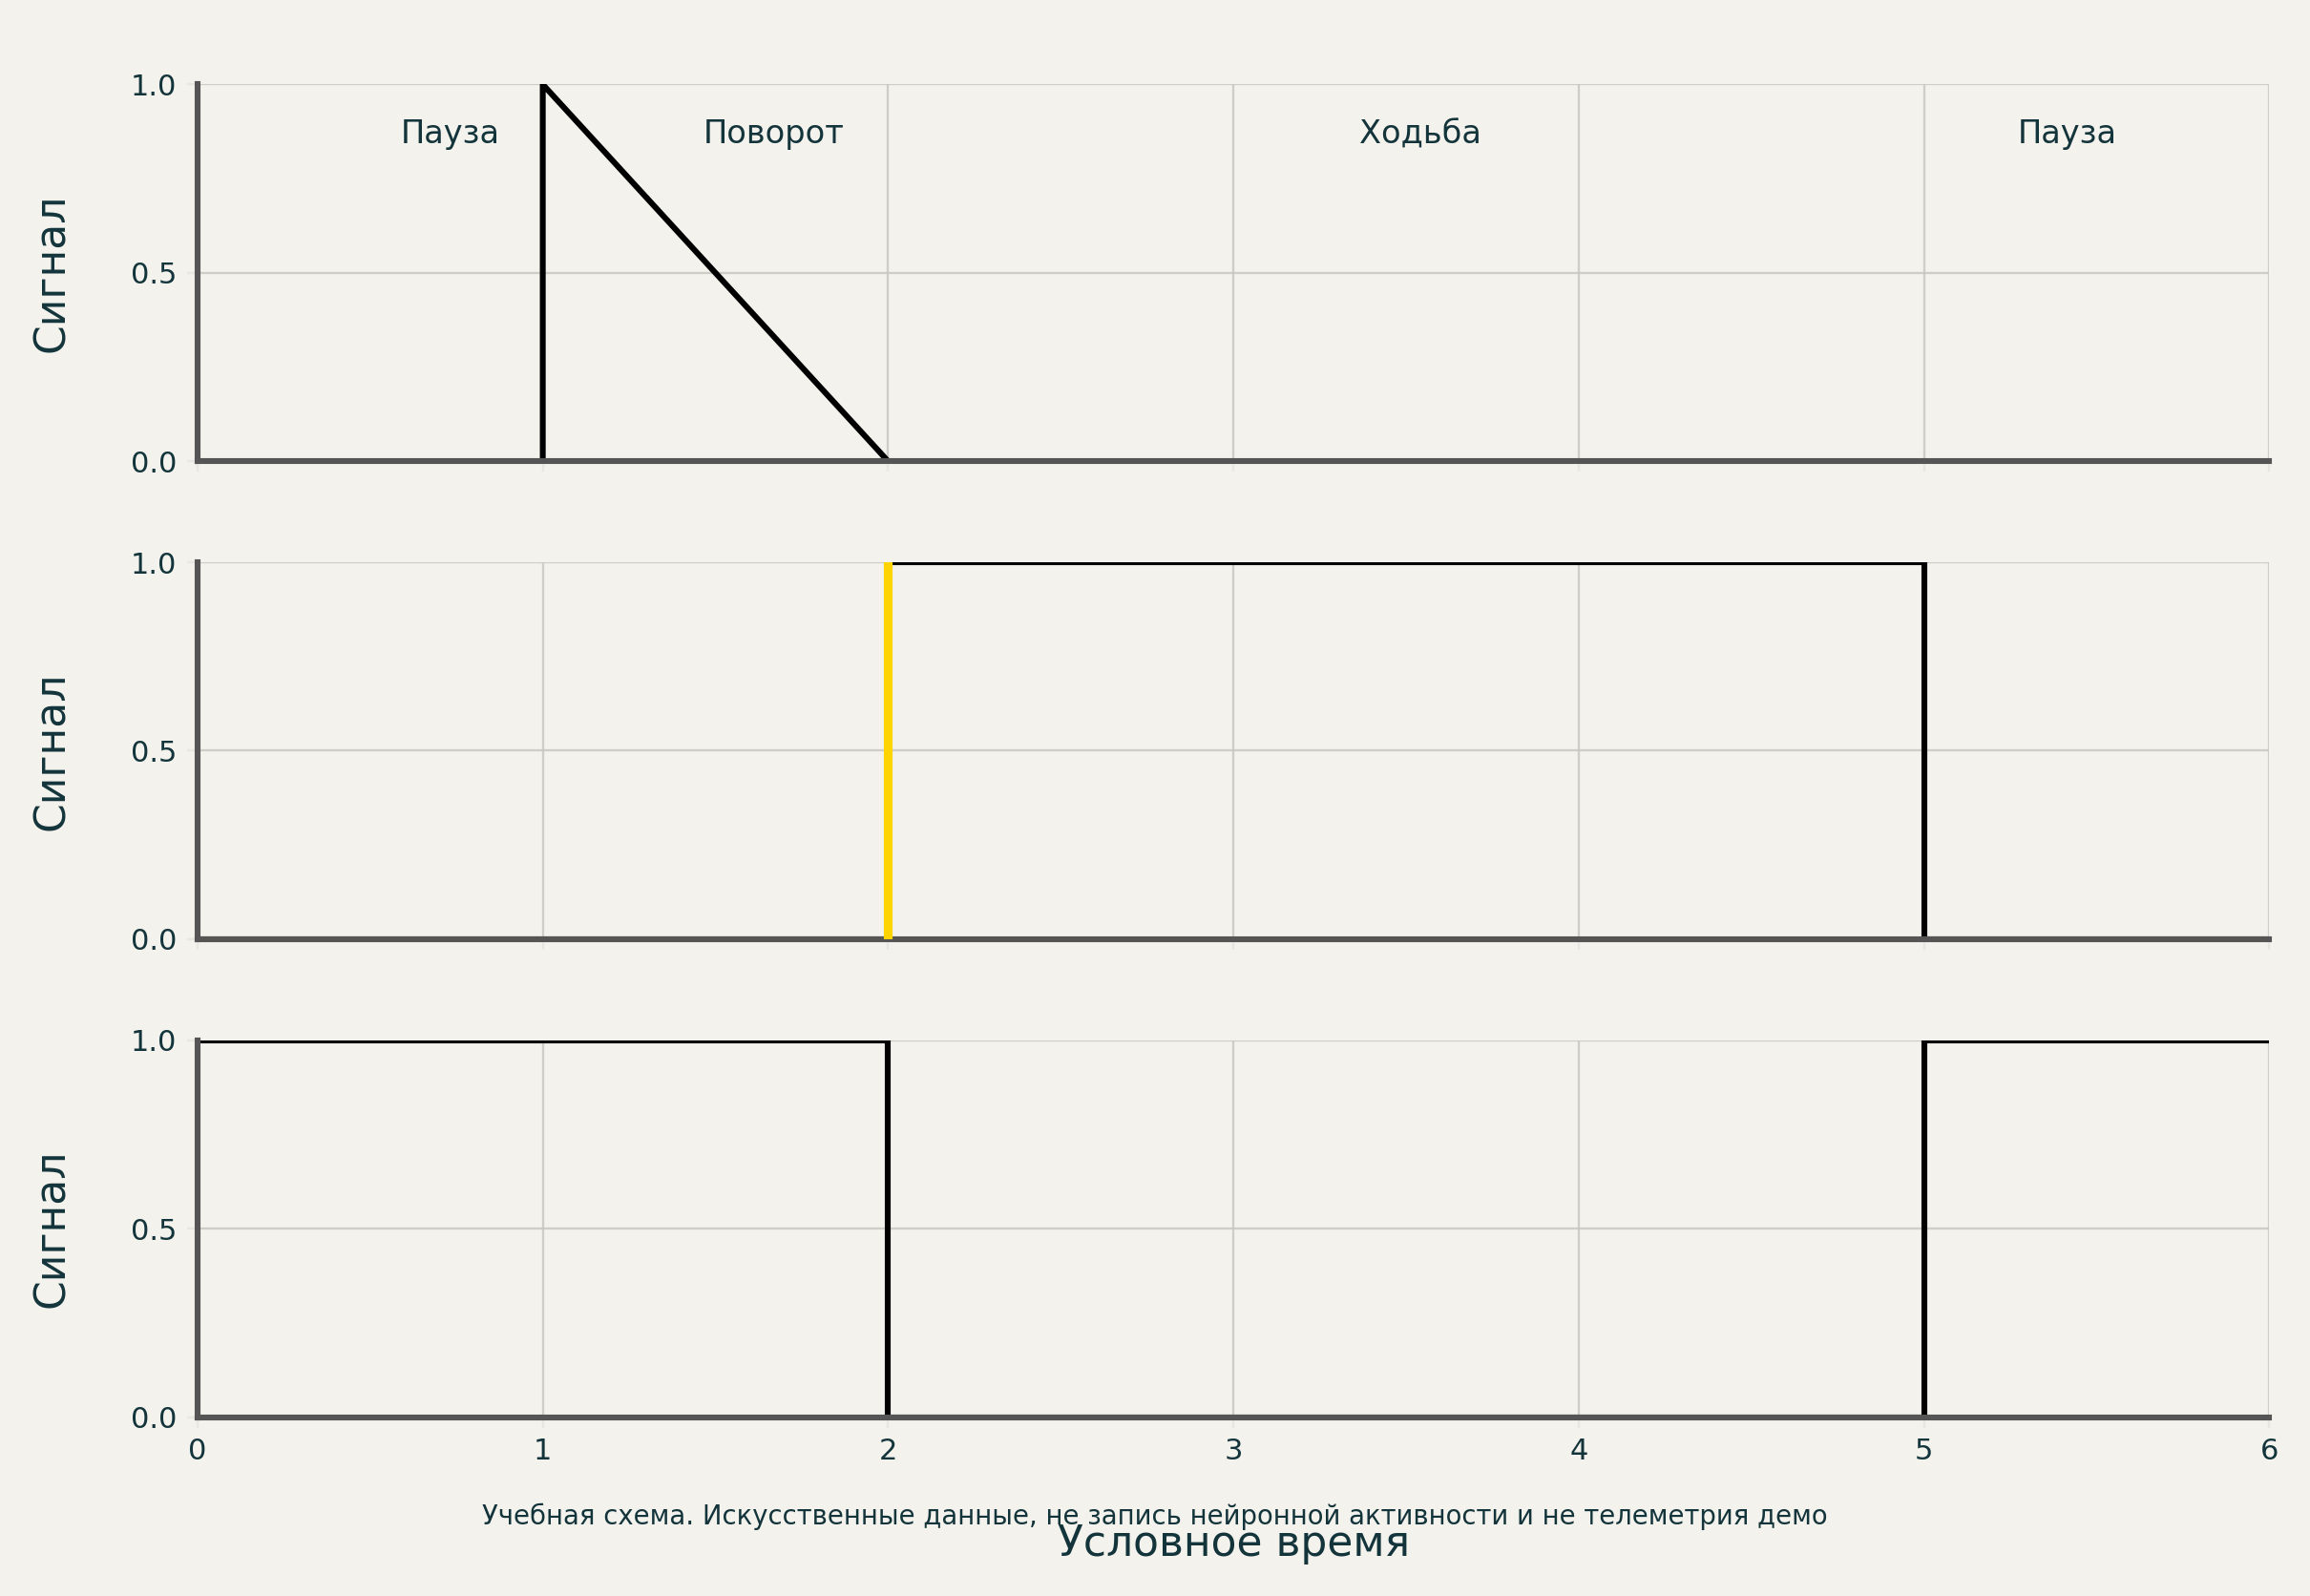
The leg animation follows the body’s movement and the terrain. It neither chooses a route nor substitutes for a biomechanical muscle model.
Back to watching the fly
Open our demo again and the fly’s walk will look the same: it stops, turns, and moves on. But now the mechanism behind those movements is clear: the program picks a target and issues commands. It still looks like a purposeful search for an exit, even when we know how the illusion works.
A scientific brain model faces a stricter question: which real responses does it help explain and predict? Testing it against a living nervous system is what makes the digital fruit fly story interesting far beyond games.
Our fly gets a helmet, six legs, and an endless shift on E1M1.